No time to read now?
-> Download the article as a handy pdf
List of contents
Do PV Activities Today Really Save Lives?
Comparing historical statistics to current ones (2010 – 2019)
Martti Ahtola | Jun 23, 2020

As we wrote in our blog The Background to the Current EU PV Legislation, one of the key justifications for the current pharmacovigilance legislation was that ADRs “caused around 197,000 deaths per year in the EU.”[i] This figure is still on the EMA website and by itself it is a very good reason for all the pharmaceutical companies to perform PV activities.
We wanted to find out if the figure has now gone down since the new legislation has been effective for almost 10 years to see if the legislation’s intended purpose is in fact effective.
TLDR:
- Justification for current PV legislation is largely based on historical statistics that do not necessarily apply to EU and today
- We downloaded over half a million ICSRs from EV for the 2010-2019 period to find that while the number of reported serious ADRs has doubled, percentage of hospitalization and deaths remained stable
- Eurostat and Finland statistics show that a marginal number of hospitalization and deaths were due to ADRs
- Thorough review of large sets of available data is required and legislation updates are needed
- In short, the cost of pharmacovigilance activities has increased significantly without any measurable impact on the number of deaths and hospitalization caused by adverse drug reactions.
- Call to action is needed to modernize pharmacovigilance and move it to a value-based field of healthcare
Background
The number of approximately 200,000 deaths caused by adverse events caused by medicinal products annually is an estimate that originally started appearing in PV related documents in the EU around 2004. The large number of deaths was later used to push through the major legislative updates during 2005-2012. These updates have been the main reason to the significant increase in the cost of pharmacovigilance activities [ii].
There were other reasons for the legislation update as we described in our blog. The other two main reasons were the costs due to hospitalization caused by ADRs (and ADRs experienced during hospitalization) and the complexity and irrationality of the previous PV legislation.
Impact Assessment
One of the earliest documents where the number of deaths can be found is the European Commission (EC) impact assessment on European PV legislation from 2008. It stated that according to the scientific literature ADRs were the fifth most common cause of death in the EU and that ADRs were responsible for about 3-10 % of all admissions to hospitals in the EU [iii]. Out of all hospitalized patients 2.1 – 6.5 % suffered an ADR and 0.12 – 0.22 % of hospital admissions resulted in death due to an ADR.
For the estimated number of hospitalization, deaths, and ADRs experienced during hospitalization in the 2008 Impact Assessment, the EC working group used as their reference a 2004 article “Pharmacoeconomics of adverse drug reactions” [iv] and 1998 article “Incidence of Adverse Drug Reactions in Hospitalized Patients” [v].
Pharmacoeconomics of Adverse Drug Reactions
The 2004 review article from Jonas Lundkvist and Bengt Jönsson refers to several studies that were published mainly during the 90s. The authors state that the incidence of all ADRs is difficult to estimate and has not been widely studied. The article also mentions that there is not much literature available on ADR related costs other than those caused by hospitalization.
“We have in the present study stressed how difficult it is to make the correct decisions in order to minimize the social costs of ADRs. Some costs are possible to estimate but the total cost of ADRs is very difficult to identify, quantify and value. From an economic point of view the problem of ADRs is not a problem of minimizing but of optimizing, to find the right balance between the costs and benefits. This issue is not well investigated but is important in order to make optimal regulatory decisions in the drug market. [vi]“
“[…] the costs of reducing ADRs may exceed benefits and we have seen support for a policy aimed at deregulating drug markets. However, we have also seen that increased information and education at the pharmacy (pharmaceutical care) could produce large cost savings due to reduced incidence of drug-related problems, which indicates that we instead should increase our expenditures of avoiding ADRs. [vii]“
Incidence of Adverse Drug Reactions in Hospitalized Patients
The 1998 article from Lazarou, Pomeranz, and Corey studied the incidence of serious and fatal ADRs in hospital patients. They used as their data source four databases with data from 1966 to 1996. The article estimated that with the hospital patients in the USA the overall incidence of serious ADRs was 6.7% (95% confidence interval [Ci], 5.2 – 8.2 %) and of fatal ADRs was 0.32 % (95 % CI, 0.23 – 0.41 %). They estimated that in 1994 overall 2,216,000 (1,721,000 – 2,711,000) hospitalized patients had serious ADRs and 106,000 (76,000 – 137,000) had fatal ADRs, making these reactions between the fourth and sixth leading cause of death.
Extrapolation and Outdated Information
The EC Impact Assessment used the 106,000 deaths in the USA to extrapolate that in the EU the number of deaths would be about 200,000 with the following note:
“While each study has its own strengths and weaknesses in terms of methodology, overall the literature provides compelling and consistent evidence of a major public health burden from ADRs.[viii]“
We would argue that this extrapolation was a very big guess. There are significant differences in life expectancy, obesity rate, and perhaps most importantly, the healthcare systems in the United States and EU. Put simply, population structure and living conditions are very different on each side of the Atlantic.
From our point of view, these are articles that should be used as a reference for decision made on country level – not to speak of the whole EU.
Also, for the large parts, the source material is old. Majority of the data had been collected 1960-1996. It was old when then decisions were made in 2008 but now the oldest cases are more than 60 years old.
The medicinal products, the healthcare system and the population structure has changed radically in the past 60 years.
Statistics for Hospitalization and Deaths Caused by ADRs
It seems that in 2008 the EC did not have their own official statistics on hospitalization or death. The reason could have been that the ADR related information was not collected by the officials in the Member States and reported to a central European database. Maybe the information would have been available, but this was decided not to be used.
We decided to take a look at what kind of information we have available now. There is no database for hospitalization and deaths caused by ADRs, but the data is being collected. We looked at different data sources to see if there has been a change in the number of hospitalization and deaths in the past 10 years and also to confirm the estimated number of deaths.
EudraVigilance
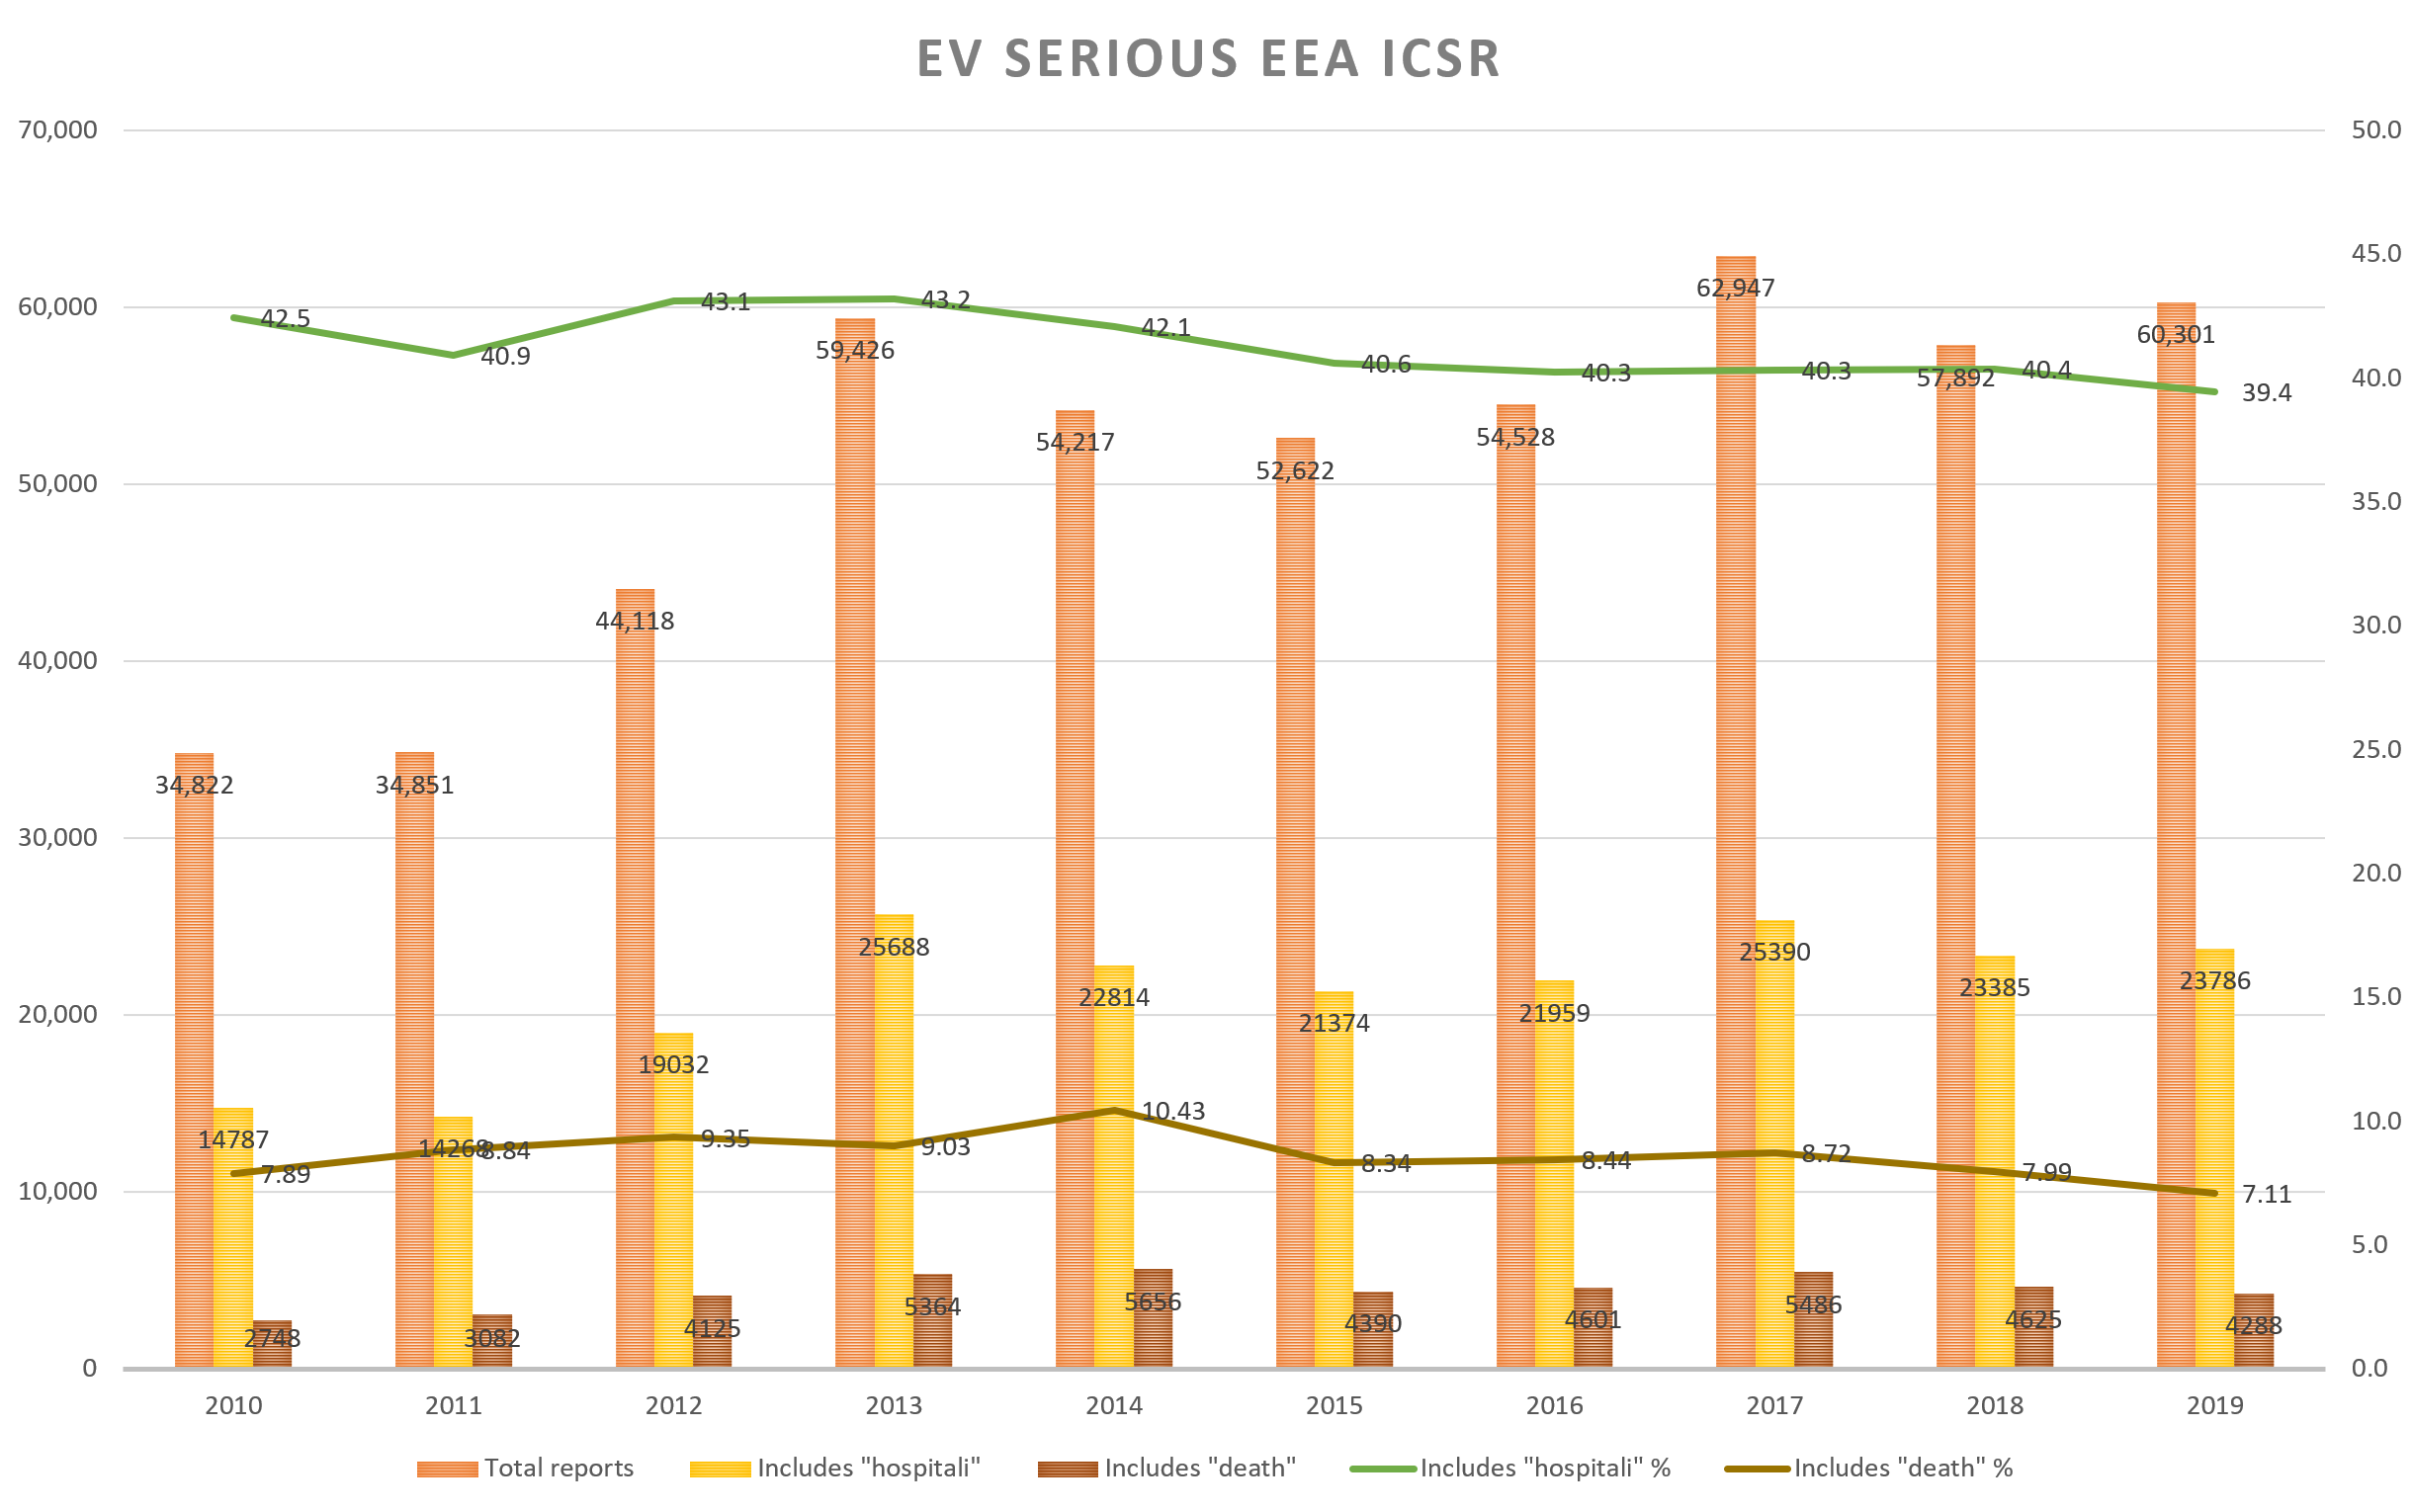
“Hospitalization and death rate remained the same in 2019 as in 2010 while the number of serious ADRs has nearly doubled in the period”.
EudraVigilance (EV) is the central database in Europe for adverse event reports[ix]. All the ADR reports from the Member States’ National Competent Authorities (NCA) and from the Marketing Authorization Holders (MAH) are forwarded to this database. From this European database the cases are still further forwarded to the WHO to their global ADR database, VigiBase[x]. The information reported EV is available to the public through www.adrreports.eu.
EV gives a glimpse into the impact of the ADRs caused by medicinal products, but unfortunately the information in the EV is limited to those cases that have been reported to the NCA or the MAH. Most of the ADRs presumably do not get reported to the authorities.
We downloaded a little over half a million ICSRs from www.adrreports.eu for the years 2010-2019. These were all serious cases originating from the EEA. When ICSRs are categorized, all reports that include death and/or hospitalisation are labelled as “Serious”.
The data shows that the relative number of cases where the field “Reaction List PT (Duration – Outcome – Seriousness Criteria)” includes either the term “death” or “hospitali” has remained the same over the time period of 2010 – 2019 (see chart below.) The rate of terms hospitalization (41 %) and death (8.5 %) has remained approximately the same among serious EEA ICSRs while the number of serious cases reported to EV has almost doubled.
Eurostat
“In 2010, 0.1% of deaths was due to other external causes of morbidity and mortality”.
Eurostat is a source of statistical data collected from the Member States[xi]. The website includes different kind of data sets that can be viewed and downloaded by the public. One of the key categories of this database is health. This category includes information about hospital stays and causes of death.
For causes of death, ICD-10 category Y40-Y59 is reserved for the ADRs[xii]. For example, Y40 is a death caused by systemic antibiotics. In the data available on Eurostat these categories are not displayed on their own, but they are included in a category called “Other external causes of morbidity and mortality”. In 2010, this category was the cause of death in 5,583 (0.1 %) cases.
Eurostat is not listing the causes of hospitalization, but they show the number of hospital discharges and bed days among other health related statistics. The number of hospital discharges and bed days in healthcare has remained approximately the same between 2010-2017 which can be considered an improvement considering population growth and aging[xiii].
To receive more detailed information, we contacted Eurostat user support. They were very helpful and fast to provide us with help and we are now waiting to receive a more detailed data set by end of June; a follow-up blog post to be expected.
Finland
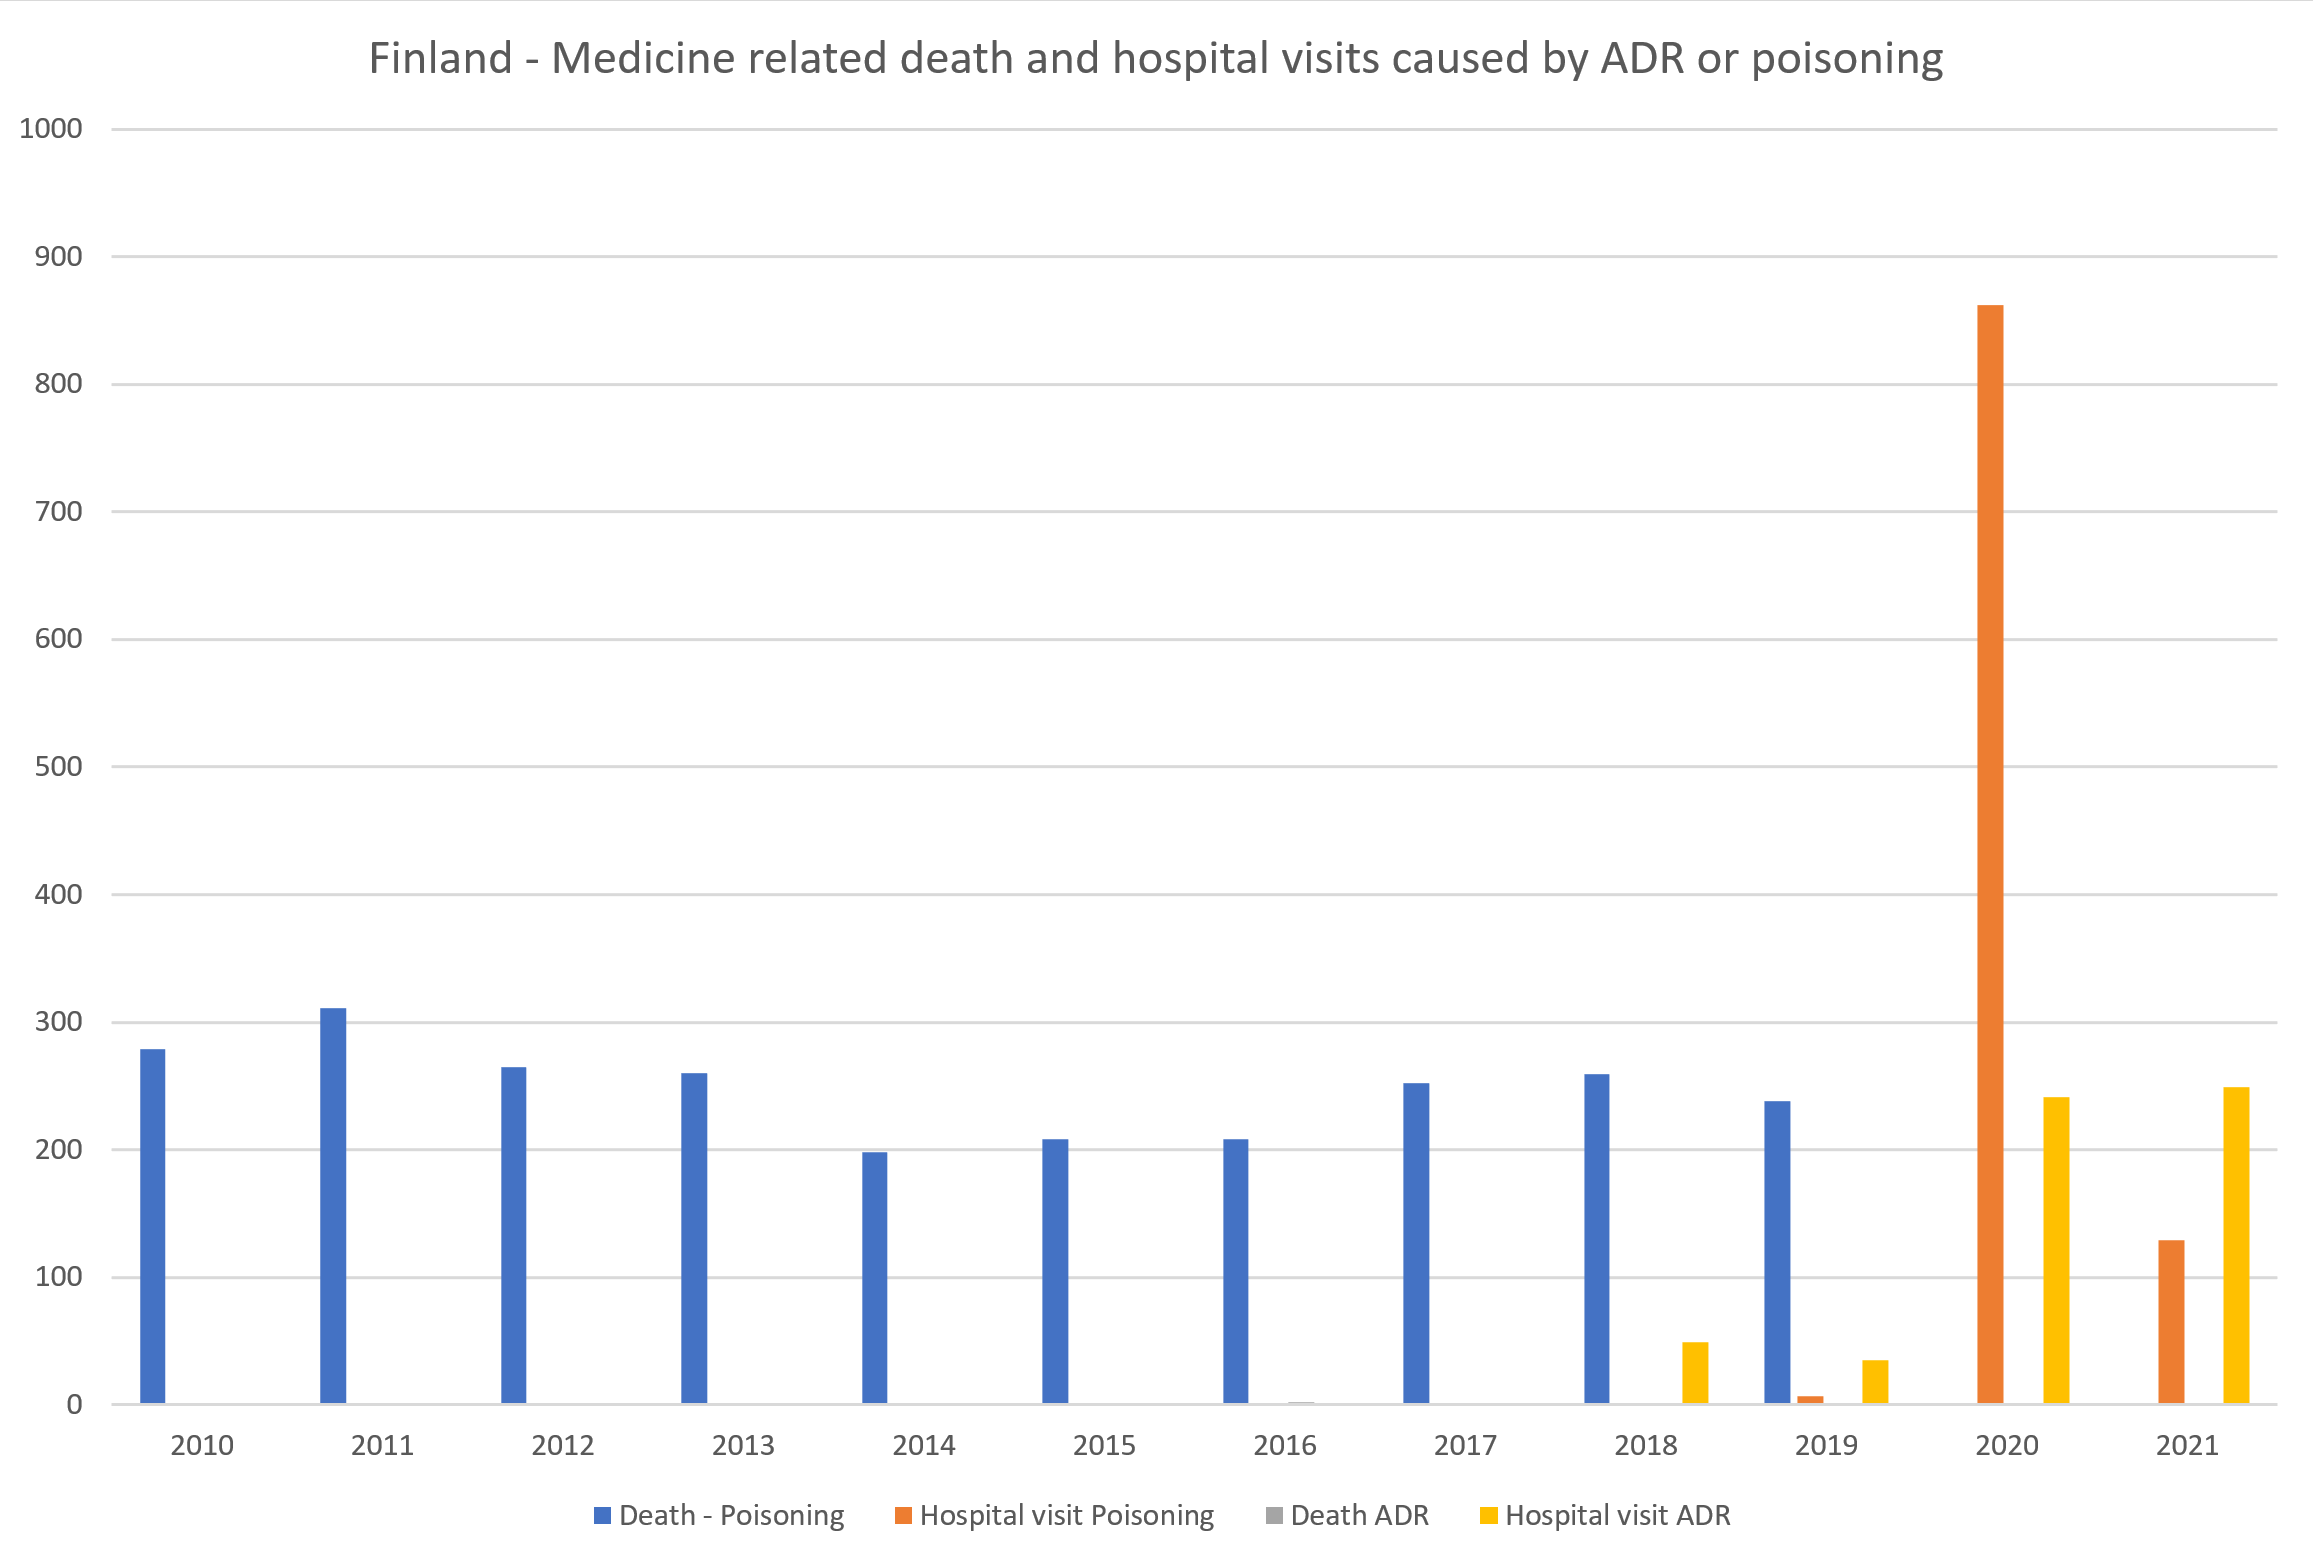
“In Finland, “only” 5 deaths have been due to ADRs between 2010-2019.”
As a short case study, we looked at our home country’s data. On the Statistics Finland website’s database for causes of death, the categories Y40-Y59 are available on detailed 3-character level[xiv].
We downloaded from the Statistics Finland website information about deaths caused by categories Y40-Y59 during the years 2010-2019. During this period, “only” 5 deaths in total were recorded to have been caused by an ADR.
It is notable that when we contacted Statistics Finland for help, they pointed us towards the ICD-10 categories X40-X44 which are deaths caused by “accidental poisoning by and exposure to…”:
- X40 Accidental poisoning by and exposure to nonopioid analgesics, antipyretics and antirheumatics
- X41 Accidental poisoning by and exposure to antiepileptic, sedativehypnotic, antiparkinsonism and psychotropic drugs, not elsewhere classified
- X42 Accidental poisoning by and exposure to narcotics and psychodysleptics (hallucinogens), not elsewhere classified
- X43 Accidental poisoning by and exposure to other drugs acting on the autonomic nervous system
- X44 Accidental poisoning by and exposure to other and unspecified drugs, medicaments and biological substances
These categories were the cause of death in Finland during years 2010 – 2019 in almost 2,500 deaths (see chart below).
THL provides statistics about the causes of hospital visits (not hospitalization) in their database following the ICD-10 categories from 2018 onwards.[xv] The medicine related causes Y40-Y59 and X40-X44 are grouped in two categories (see chart below).
The Data is Available
There is information available related to deaths and hospitalization caused by adverse drug reactions. However, in the current situation it is difficult or impossible to say what is the impact of pharmacovigilance to these figures.
In most cases, the figures have remained the same throughout the years or there are no reported cases at all. PV professionals may not like it, but it would be hard to put on a straight face and say that pharmacovigilance activities have decreased the number of deaths and hospitalization.
This is probably no secret to the EC or to the EMA. So how are they measuring the effectiveness of pharmacovigilance?
EMA’s strategy to measuring the impact of pharmacovigilance activities
In January 2016, the PRAC Interest Group on Impact was established[xvi]. In 2017, the PRAC established a strategy for measuring the impact of pharmacovigilance activities[xvii], to change the focus of pharmacovigilance activities and regulatory tools to those that are most relevant to patients and make the biggest difference in daily healthcare. This strategy document lists as ongoing activities among other things:
- “Collect and collate available data on existing activities within the EU regulatory network relevant to measurement of the impact of pharmacovigilance activities; […]
- Develop guidance on methodologies for measuring the impact of pharmacovigilance activities in the ENCePP Guide on Methodological Standards in Pharmacoepidemiology (routine revision 2018).”
The ENCePP Guide on Methodological Standards in Pharmacoepidemiology has been published and updated[xviii]but no further information related to measuring impact of pharmacovigilance has been since communicated by the EMA.
Literature Review of the Current Situation
Google search on the topic gives the picture that not much reliable or large-scale systematically collected and reported information about the current situation in the EU is publicly available. EMA, ENCePP, Eurostat or OECD have not published any information related to the possible cost savings or to the reduced number of hospitalization or death.
The impact of pharmacovigilance activities at the population level is still an area that is not investigated sufficiently due to the challenges in gathering relevant data and previous lack of methods[xix].
Based on studies conducted in the recent years[xx] the rates of admissions to hospital due to ADRs and ADRs occurring during the hospital stay seem to be on the same level as 25 years ago. However, we should note that the data in the publications still relies on small national studies, extrapolation and estimates. This is still the kind of data that should not be used as source for legislative decision making.
The general opinion is that the costs of pharmacovigilance to the pharmaceutical companies and to the public will increase due to the required improvements to the drug safety related activities[xxi].
Conclusion
In short, the cost of pharmacovigilance activities has increased significantly without any measurable impact on the number of deaths and hospitalisation caused by adverse drug reactions.
What can we do about it?
We are in a completely different place technologically compared to 2008 when the estimate of “200,000 deaths caused by ADRs” was made. Still this information is considered as valid.
Unfortunately, as we know, the improvement in technology does not really always apply to the healthcare sector or usually to public sector in general. There are Big Data projects ongoing on European level and nationally in several of the member states, but that’s it[xxii]. There are big projects but very little useful, working applications available.
Today, nobody can tell if the pharmacovigilance activities are leading to less hospitalization and deaths caused by ADRs. We have a slightly better idea of what kind of ADRs people experience thanks to EudraVigilance and adrreports.eu but we are still far from being able to reliably see the trends in real world data of patients having ADRs, being hospitalized because of them or even dying due to an ADR and the impact of PV activities on these numbers.
A good example of the challenges in this area are the death numbers caused by COVID-19. According to Eurostat[xxiii]:
“COVID-19 has triggered a considerable interest in high-frequency mortality statistics. However, users are often exposed to different data sources and a variety of figures and analyses, which are not always complemented with consistent background information on methodologies, data coverage and reliability. Whilst the comparability of data strictly associated with the pandemic across the data sources may still be arguable, due to different rules of classifying diseases and causes of death, total mortality can be a viable alternative for monitoring the direct and indirect effects of the crisis.”
So even when there is an unprecedented interest in the infection, hospitalization and death rates (and now also the safety of the vaccination) caused by just one disease, we are still not able to get reliable figures on anything else except the total number of deaths. One can only imagine how far we are from getting reliable figures on a complex topic such as ADRs.
As we’ve argued before and will keep arguing for as long as we exist and until it happens, Pharmacovigilance needs to modernize and shift to what can be called as value-based healthcare industry. And it needs to happen now.
We need:
- Change in thinking by the regulators
- Thorough revision of available data and use in updating the legislation
- Focus on efficacy of PV processes versus simply adding new requirements with little justification
- Use of efficiency as a key quality objective
- Removal of massive time effort and cost burdens that are today predominant in PV with little or no added value
Pharmacovigilance is still important without any question; this we can see especially in urgent global health emergencies as the current pandemic. But the routine safety monitoring requirements need to be updated. Today, they impose a large time effort and cost burden on highly qualified people who end up spending most of their time on activities that in the end seemingly add very little actual value, even as that may be tough to hear to PV professionals.
Until the legislation is improved, it is down to us, industry stakeholders, to lead the change to modernization and create processes and tools to decrease the massive cost in routine PV, allowing highly trained life science professionals to spend more of their time on things that really matter, and perhaps actually save patients’ lives.
References
[i] EMA Legal framework: Pharmacovigilance: https://www.ema.europa.eu/en/human-regulatory/overview/pharmacovigilance/legal-framework-pharmacovigilance
[ii] Pharmacovigilance Market Size, Share & Trends Analysis Report By Service Provider, https://www.grandviewresearch.com/industry-analysis/pharmacovigilance-industry
[iii] European Commission, Impact Assessment, https://ec.europa.eu/health/sites/health/files/files/pharmacos/pharmpack_12_2008/pharmacovigilance-ia-vol1_en.pdf
[iv] Pharmacoeconomics of adverse drug reactions, 2004, https://pubmed.ncbi.nlm.nih.gov/15147278/
[v] Incidence of adverse drug reactions in hospitalized patients: a meta-analysis of prospective studies, J Lazarou, BH Pomeranz, and PN Corey, 1998, https://pubmed.ncbi.nlm.nih.gov/9555760/
[vi] Pharmacoeconomics of adverse drug reactions, 2004, https://pubmed.ncbi.nlm.nih.gov/15147278/
[vii] Ibid.
[viii] European Commission, Impact Assessment, https://ec.europa.eu/health/sites/health/files/files/pharmacos/pharmpack_12_2008/pharmacovigilance-ia-vol1_en.pdf
[ix] EMA, EudraVigilance, https://www.ema.europa.eu/en/human-regulatory/research-development/pharmacovigilance/eudravigilance
[x] WHO, What is VigiBase?, https://www.who-umc.org/vigibase/vigibase/
[xi] Eurostat, https://ec.europa.eu/eurostat
[xii] WHO, ICD-10 Version: 2019, https://icd.who.int/browse10/2019/en#/Y40-Y59
[xiii] Eurostat, Database https://ec.europa.eu/eurostat/web/health/data/database
[xiv] Statistics Finland, Deaths by underlying cause of death (ICD-10, 3-character level), age and gender, 1998-2019, https://pxnet2.stat.fi/PXWeb/pxweb/en/StatFin/StatFin__ter__ksyyt/statfin_ksyyt_pxt_11bv.px/
[xv] THL, Avohilmo: Perusterveydenhuollon avohoidon ICD-10 – käyntisyyt, https://sampo.thl.fi/pivot/prod/fi/avo/perus06/fact_ahil_perus06
[xvi] EMA, The PRAC Strategy for Measuring Impact of Pharmacovigilance Activities, https://www.ema.europa.eu/en/documents/presentation/presentation-prac-strategy-measuring-impact-pharmacovigilance-activities-thomas-goedecke_en.pdf
[xvii] EMA, Pharmacovigilance: Overview, https://www.ema.europa.eu/en/human-regulatory/overview/pharmacovigilance-overview#comment-56358
[xviii] The European Network of Centres for Pharmacoepidemiology and Pharmacovigilance (ENCePP) Guide on Methodological Standards in Pharmacoepidemiology, http://www.encepp.eu/standards_and_guidances/documents/GuideMethodRev8.pdf
[xix] Measuring the impact of pharmacovigilance activities, challenging but important, https://www.ncbi.nlm.nih.gov/pmc/articles/PMC6783581/
[xx] Adverse Drug Reactions in Hospitalized Patients: Results of the FORWARD (Facilitation of Reporting in Hospital Ward) Study, Claudia Giardina, Paola M. Cutroneo, Eleonora Mocciaro, Giuseppina T. Russo, Giuseppe Mandraffino, Giorgio Basile, Franco Rapisarda, Rosarita Ferrara, Edoardo Spina, and Vincenzo Arcoraci, 2018, https://www.ncbi.nlm.nih.gov/pmc/articles/PMC5904209/#:~:text=ADRs%20occurred%20in%20153%20patients,before%20and%20during%20hospital%20stay; The occurrence, types, consequences and preventability of in-hospital adverse events – a scoping review, René Schwendimann, Catherine Blatter, Suzanne Dhaini, Michael Simon, Dietmar Ausserhofer, 2018, https://bmchealthservres.biomedcentral.com/articles/10.1186/s12913-018-3335-z
[xxi] Pharmacovigilance in Crisis: Drug Safety at a Crossroads, John Price, 2018, https://pubmed.ncbi.nlm.nih.gov/29605513/ ; Current state of biologic pharmacovigilance in the European Union: improvements are needed, Thomas Felix, John B. Jordan, Catherine Akers, Bina Patel & Daniela Drago, 2019, https://pubmed.ncbi.nlm.nih.gov/30714424/
[xxii] HMA/EMA Joint Big Data Steering Group, https://www.hma.eu/506.html?&L=0
[xxiii] Eurostat, Weekly death statistics, https://ec.europa.eu/eurostat/statistics-explained/index.php?title=Weekly_death_statistics&stable
Did you like the article? Share with your network!
…or tell us your opinion.

Follow our newsletter!
Keep up with industry trends and get interesting reads like this one 1x per month into your inbox.
Learn more about Tepsivo
We deliver modern PV solutions to fulfill your regulatory needs using less resources. See how we do it >

0 Comments